---
title: 'In-class Exercise 6'
subtitle: '[Time on the Horizon: ggHoriPlot methods](https://r4va.netlify.app/chap20)'
author: "Victoria Neo"
date: "02/24/2024"
date-modified: "last-modified"
format:
html:
code-fold: true
code-summary: code block
code-tools: true
code-copy: true
execute:
eval: true
echo: true
freeze: true
warning: false
message: false
---
```{r}
pacman::p_load(ggHoriPlot, ggthemes, tidyverse)
```
```{r}
averp <- read_csv("data/AVERP.csv") %>%
  mutate(`Date` = dmy(`Date`))
```
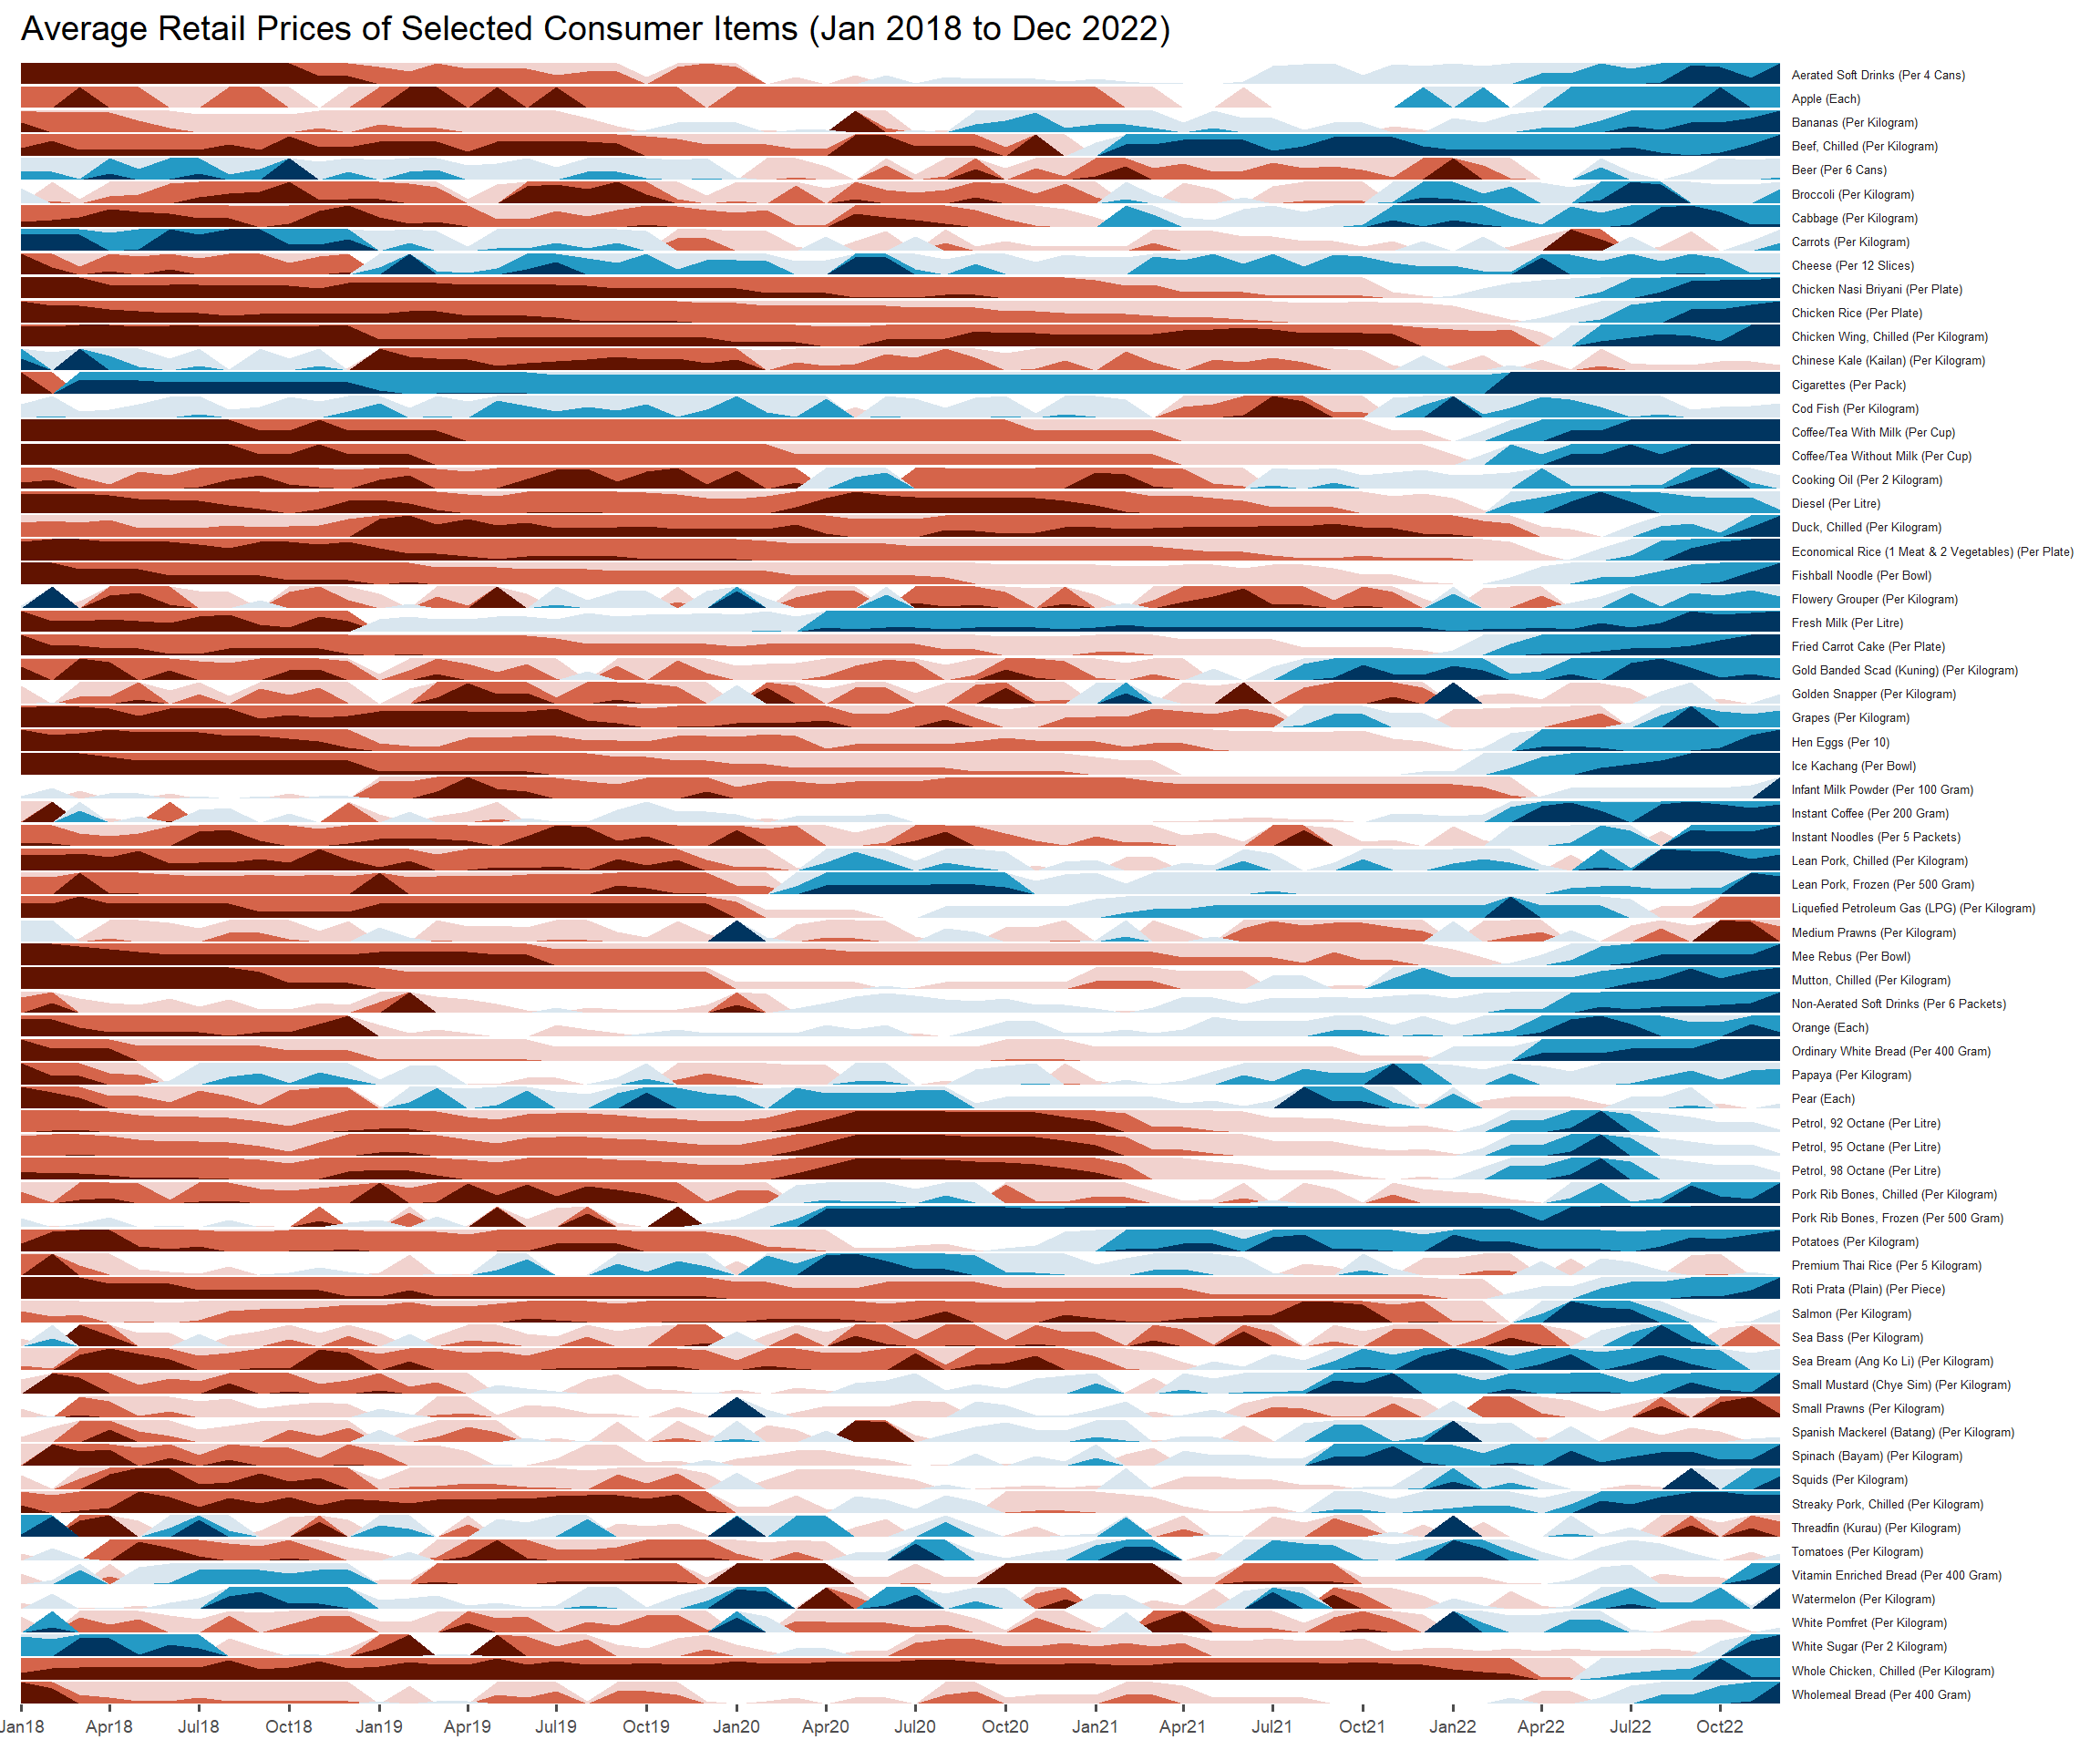
```{r}
#| fig-width: 12
#| fig-height: 10
averp %>%
  filter(Date >= "2018-01-01") %>%
  ggplot() +
  geom_horizon(aes(x = Date, y=Values),
               origin = "midpoint",
               horizonscale = 6)+
  facet_grid(`Consumer Items`~.) +
    theme_few() +
  scale_fill_hcl(palette = 'RdBu') +
  theme(panel.spacing.y=unit(0, "lines"), strip.text.y = element_text(
    size = 5, angle = 0, hjust = 0),
    legend.position = 'none',
    axis.text.y = element_blank(),
    axis.text.x = element_text(size=7),
    axis.title.y = element_blank(),
    axis.title.x = element_blank(),
    axis.ticks.y = element_blank(),
    panel.border = element_blank()
    ) +
    scale_x_date(expand=c(0,0), date_breaks = "3 month", date_labels = "%b%y") +
  ggtitle('Average Retail Prices of Selected Consumer Items (Jan 2018 to Dec 2022)')
```